Reporting and
Analytics Software
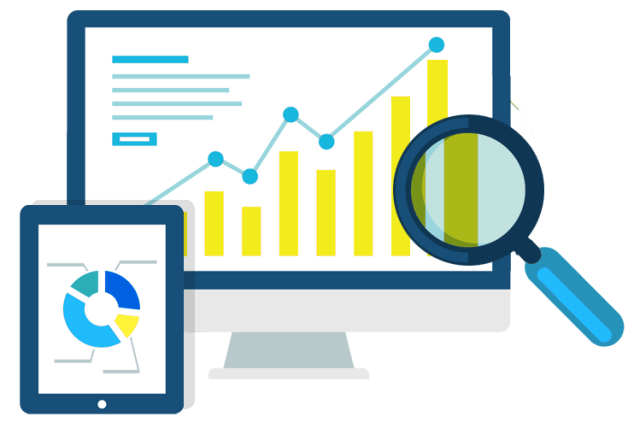
Analytics is a self-service BI and data analytics software that lets you create visually appealing data visualizations and insightful dashboards in minutes.Transform huge amounts of raw data into actionable reports and dashboards. Track your key business metrics, see longtime trends, identify outliers, and unearth hidden insights
What you can do with our
Analyses and Reporting
The only enterprise analytics suite that combines industry-leading action based dashboards, automated discovery and data storytelling.


Dashboards
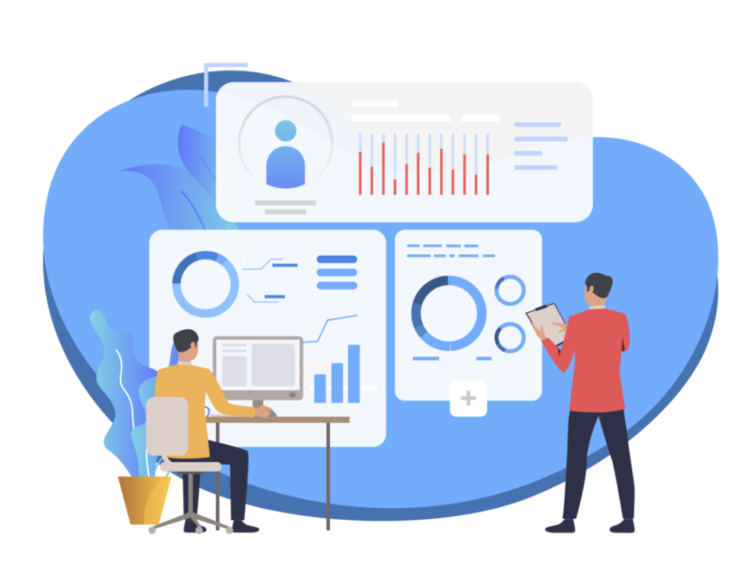
Monitor KPIs and deliver AI-powered dashboards. Assisted Insights finds the right data to analyze, identifies the most statistically relevant results, and presents the findings so you can get to the why faster.

Data Discovery
Accelerate your analysis with Assisted Insights. Visualize and share with industry-leading collaboration tools. Findings can be shared to many workflows and reused in Dashboards, Stories, and Storyboards.

Data Prep
Prepare your data for analysis. Connect HRMS has everything you need to connect and extract data from all your business sources, including spreadsheets, Web APIs, and databases.
New Feature
Highlights
- Create beautiful and meaningful dashboards.
- Build actionable and engaging experiences on the fly.
- Collaborate and short cut the design process.
- Short cut your dashboard design process.
- If you can think it, you can build it.
- A new bilateral editor to help you create experiences we haven’t even thought of.
- You can now upload your own corporate fonts into Yellowfin and make it available to your end users.
- A new REST API has been introduced to enable developers to fully integrate Signals, Stories, and Collaboration capabilities into any custom front end application.
- Charts elements now automatically switch off or re-order themselves – axis labels, ticks, legends – according to the allocated size on the dashboard.


